Monday, March 26, 2012

HCL Technologies Limited - Revenue Analysis & Operating Metrics 2006-2011

HCL Technologies Limited - Financial Performance 2006-2011
Financial Performance:
  • 2009 revenue growth was affected due to global recession and Financial crisis and YoY growth was only 17%. YoY growth picked up again in 2010 ( 24%) and 2011 (31%) 
  • Reduced Operating expenses by almost half in 2009 (17% YoY) but again increased according to the revenue growth. 
  • Negative YoY growth in net profit in 2008 (-11%) and 2009 (-6%) but profitability significantly increased in 2011 (35% YoY)
HCL Technologies Limited - Geography Mix 2006-2011 
Geography Analysis:
  • Dependency on the US market is always high and the contribution reduced in 2011 compared 2010 but still 56% revenues come form the region. Peaked in 2010 with 62% of revenues. 
  • Europe is the second largest market but the contribution fell in 2010 but again increased in 2011 and historically HCL had strong presence in Europe. 
  • Rest of the world is also increasing compared to previous years and the company is looking to increase further. 
HCL Technologies Limited Vertical Revenue Mix 2006-2011
Vertical Analysis:
  • Manufacturing is the core vertical but the revenue contribution has been falling. 
  • Financial Services second largest vertical and growth is constant. 
  • Telecom is the third largest vertical but revenues have fallen significantly since 2009.  
  • Retail & CPG have fallen in 2007 and constant since. Healthcare revenues are constant in last two years. 
  • Energy Utilities and public sector have seen constant growth since 2009. 
HCL Technologies Limited -Services Revenue Mix 2006-2011
Services Segment Analysis:
  • Custom Application Services is the largest offering followed by Engineering R&D Services. Custom application services saw growth in 2011 and Engineering R&D services fell in 2011 compared to 2010. 
  • Enterprise Application services is growing constantly in the last three years between  21-24%. 
  • Infrastructure services are seeing significant growth from 15% in 2008 to 23% in 2011. 
  • BPO services revenue is falling since 2006 from 13% to 6% in 2011. 
HCL Technologies Limited Contract Type 2006-2011
Time & Material contracts are the most preferred. But the Fixed price contracts are also seeing growth since 2008.


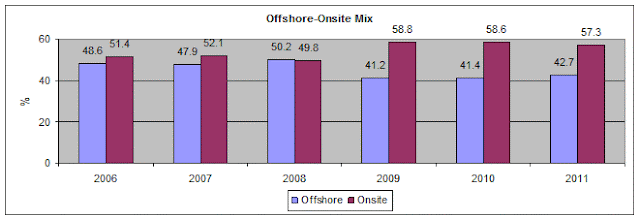
HCL Technologies Limited Onsite/Offshore Mix 2006-2011
Onsite has always been dominant contributor for HCL Tech but since 2009 the contribution significantly increased.

Source: Company Investors Site                               Website : www.hcltech.com/investors

Cognizant Technology Solutions Corp - Revenue Analysis & Operating Metrics 2006-2011

Cognizant Technology Solutions Corp - Financial Performance 2006-2011
Financial Performance:
  • Except in 2009 (16% YoY) due to recession caused by Global Financial Crisis Cognizant had seen significant YoY revenue growth 2010 (40%) and 2011 (33%). But compared to other Indian Top players Cognizant has done really well during and after the recession and crisis. 
  • Significantly reduced the operating expenses during FY 2009 and later increased operating expenses in line with the revenue growth. 
  • Cognizant has overtaken Wipro and became the Number 3 player and is closely following on the heels of number 2 player Infosys. Cognizant had seen tremendous growth in the past few years. 
Cognizant Technology Solutions Corp - Geography Mix 2006-2011

Geography Analysis:
  • Dependency on the North America is very high compared to other Indian Players and it gets almost 80% of revenues from the region. 
  • Europe has been constant at 18-19%. 
  • Rest of the World ( APAC, Latin America, MEA) revenues are small but growing slowly. 
Cognizant Technology Solutions Corp - Vertical Revenue Mix 2006-2011

Vertical Analysis:
  • Cognizant is the dominant player in the BFSI segment and it gets significant amount of revenues from Insurance segment along with financial services segment. 
  • Healthcare is the second largest revenue contributor and has significant dominance in this vertical and Healthcare spending in US is on the rise.  
  • Manufacturing/Retail/logistics is growing over past three years.  
  • Cognizant focuses on these few verticals for growth. 
Source: Company Investors Site                                     Website: http://investors.cognizant.com/

Wipro Limited - Revenue Analysis & Operating Metrics 2006-2011

Wipro Limited Financial Performance 2006-2011
Financial Performance:
  • Wipro saw revenue growth slowing down during 2009 (10% YoY) due to recession caused by 2008 Global Financial Crisis but revenue growth doubled in 2010 (20% YoY) which highlighted the fact that Wipro did well during 2010 compared to its peers.  
  • 2011 (17% YoY) is a different story as the company struggled with its Dual CEO structure and was forced to replace them by single CEO in January 2011 and there were other organizational changes too which affected its revenue growth. Its peers did tremendously well in 2011. 
  • Wipro reduced its operating expenses significantly in 2009 due to the cost cutting measures that the company adopted and since then there has been constant rise in expenses along with revenues. With significant organization and leadership changes the company is planning to recover its lost growth. 
Wipro Limited Geography Mix 2006-2011
Geography Analysis:
  • Dependency on the North American is constantly being reduced as evident in the above chart but still 55% revenues are from that region. 
  • Europe is the second largest market but the revenues have fallen since 2009 and constant at 26%-27% and the region is struggling to cope with Sovereign Debt crisis. 
  • India & Middle East market is growing significantly particularly in India it has won some big contracts from Government of India and other State governments. 
  • APAC and other markets are also seeing good growth and Japan is constant. 
Wipro Limited Vertical Revenue Mix 2006-2011
Vertical Analysis:
  • Like its peers Wipro is also dependent on BFSI vertical for majority of its revenues and it is one of the significant player. 
  • Manufacturing is the second largest and constant growing vertical. Retail & Transportation too has been constantly growing over the years. 
  • Wipro is a significant player in the Energy  & Utilities vertical and has maintained constant revenues. Technology vertical revenues have been falling and Telecom vertical revenues are constant. 
  • Communication and Media and Healthcare Services have also seen good growth in the last few years. 
Wipro Limited Services Revenue Mix 2006-2011
Services Segment Analysis:
  • Application Development & maintenance services is the largest service offering but dependency on the offering has reduced over years as Wipro was looking to increase revenues from other services. 
  • Revenues from Technology Infrastructure services saw significant growth and the company had invested significantly for increasing the revenues in this service offering. 
  • Testing services is constant revenue contributor. Package Implementation too constant revenue generator. 
  • Wipro also focused on constantly increasing the BPO revenues. 
Wipro Limited Contract Type 2009-2011
Time & Material contracts are the most preferred. But the Fixed price contracts are also seeing growth since 2009.

Wipro Limited Onsite/Offshore Mix 2006-2011
Onsite has always been dominant contributor for Wipro. Except in 2009-2010 when clients to reduce cost favored offshore. In 2011 onsite saw growth.

Source: Company Investors site                                      Website: www.wipro.com/investors

Infosys Limited - Revenue Analysis & Operating Metrics 2006-2011

Infosys Limited Financial Performance 2006-2011
Financial Performance:
  • Global recession due to the 2008 Global financial crisis have slowed down the revenue growth in 2009 (12% YoY) and 2010 (3% YoY). Growth recovered in 2011 with revenues growing by 26% YoY. 
  • Infosys was able to control its operating costs as is evident in the operating expenses growth in 2009 (10% YoY) and 2010 (2% YoY). Stringent cost cutting measures were adopted and the company kept up its operating margins and profitability during this time. 
  • Infosys saw good growth in 2011 as the company saw revenue and profitability both growing and also had improved its spending for growth. 
Infosys Limited Geography Mix 2006-2011

Geography Analysis:
  • Infosys is most dependant on North America with more than 65% revenues as American companies are at forefront of the outsourcing industry. 
  • Europe is the second largest market but the revenues in the region had been falling due to the European sovereign debt crisis and UK companies are also reducing outsourcing to India. 
  • Slightly improving business from Rest of the World. 
  • Indian presence is very low not a focus area. 
Infosys Limited Vertical Revenue Mix 2006-2011

Vertical Analysis:
  • BFSI is the dominant vertical for Infosys (36%) and one of the major player in the industry. 
  • Manufacturing is second largest vertical which has seen good growth in 2009 and the growth is constant at 20%. 
  • Telecom was good vertical for Infosys but revenues started falling form FY 2009 and saw significant fall previous year too. Services vertical also saw revenues falling. 
  • Retail has been constantly growing over years. Rest of the verticals are maintaining constant growth over the years. 
Infosys Limited Services Revenue Mix 2006-2011

Services Segment Analysis:
  • Since 2006 Application Development and Maintenance revenues have been constantly falling from 50% in 2006 to 39% in 2011.  
  • Consulting Services & Package Implementation has seen good growth from 20% in 2006 to 26% in 2011 . 
  • Rest of the verticals have seen constant growth. Infrastructure management services saw up and down growth. 
Infosys Limited Contract Type 2006-2011

Time & Material contracts are the most preferred. But the Fixed price contracts are also seeing growth since 2009.

Infosys Limited Onsite/Offshore Mix 2006-2011

It has always been a balanced mix of onsite and offshore for Infosys except during recession years 2008 till 2010 when Offshore is preferred. 2011 saw rise in onsite revenue mix.

Source: Company Investors Site                                 Website: www.infosys.com/investors

Tata Consultancy Services Limited - Revenue Analysis & Operating Metrics 2007-2011

TCS Financial Performance – 2007-2011
Financial Performance:
  • TCS saw strong revenue growth in FY 2011 (29% YoY) compared to FY 2010 (5.4% YoY) and FY 2009 (6.8% YoY). 
  • Revenue growth in FY 2010 and 2009 affected by the global financial crisis and TCS through its strategy of improving efficiency and constant cost base kept up the profitability and delivered good results. 
  • Due to the volatile economic environment that originated from the 2008 Global financial crisis TCS was forced to control its expenses by reducing costs on travel, communications, rationalizing infrastructure and optimizing resources which was evident in constant operating expenses for FY 2008, 2009 and 2010. 
TCS Geography Mix 2007-2011

Geography Analysis:
  • North America continues to be the major market as American companies are the forefront in Outsourcing to India. US has always been the primary market with significant dependence. 
  • Europe including Continental Europe is the second largest market but facing problems due to European sovereign debt crisis. UK has seen fall in contribution since 2009 due to weakness in the Telecom sector. 
  • TCS is very active in Indian Market. TCS has many Government of India and other projects in India. 
  • Latin America is another focus area for the company but the contribution fell in 2011. 
  • APAC is also seeing good growth particularly in 2011. Middle East Africa constant contribution. 
TCS Vertical Revenue Mix 2007-2011

Vertical Analysis:
  • BFSI is the dominant vertical and TCS strengthened its position in this vertical. 
  • Telecom is the second vertical where TCS is very active and this vertical revenues has fallen down since 2009 as there is weakness in the Telecom sector. 
  • Retail & Distribution is the third largest vertical and it has gained significantly since 2009. Hi-tech vertical revenue contribution also started in 2009. 
  • Life Sciences is one vertical where TCS is constantly improving and since 2009 started to wil significant deals in Media and Entertainment vertical. 
  • All the industry verticals are seeing good growth in 2011. 
TCS Services Revenue Mix 2007-2011

Services Segment Analysis:
  • Application Development and Maintenance is the dominant service offering. 
  • BPO services have started picking up since FY 2008-2009 with Citi Bank Captive acquisition. 
  • Infrastructure services category saw slight growth and constant Engineering and Industrial services revenues. 
  • Falling revenues in Enterprise Solutions. Assurance Services seeing some growth. 
  • Global Consulting revenues are not seeing growth along with Asset leverage solutions. 
TCS Contract Type 2007-2011

Time & Material contracts are the most preferred. But the Fixed price contracts are also seeing growth since 2010.
TCS Onsite/Offshore Mix 2007-2011

Initially it was Onsite but due to recession and Financial crisis, Offshore was preferred by clients since 2009. TCS also serves clients through its Global Development center .

Source: Company Investors Site             Website: www.tcs.com/investors 

Monday, March 5, 2012

Global E-Reader Market Forecast – Decline in Growth from 2015


According to an IHS iSuppli Small & Medium Displays Market Tracker report, Shipments of monochrome e-book displays hit 27.1 million in 2011(108% YoY) from 13 million in 2010. Smaller, less expensive models with features like light weight and good battery life are driving sales. Most of the players in this segment whose models are monochrome had started adopting the color displays with touch screens in 2011 and consumer focused marketing strategy and availability of more digital content like fiction, non fiction and textbooks at affordable prices will drive growth in near future. IHS believes the players in the market have to look for new ways to attract new customers and there are growth opportunities in select vertical markets like education where the purpose of the devices will be more for reading than for other functionalities like browsing and communication.  The market will see significant growth till 2014 and will see growth decline from 2015 with tough competition from tablets. These devices are facing tough competition from tablets like Apple iPad that has significant functionality like faster browser, powerful chips for multi-media, good navigation, huge number of applications, etc. Dominant players in the market are Amazon Kindle, Barnes & Noble Nook, Sony Reader, Kyobo Reader, etc.

WitsView, a research division of TrendForce forecasted color E-Readers shipments to reach 12.3 million units in 2012 from 7.4 million units in 2011. Amazon with its low-priced Kindle Fire has strongly penetrated the market which has more than 60% market share in color E-Readers market and its pricing has become a benchmark for the tablet PCs. According to Gartner, E-reader sales are expected to reach 24.3 million units in 2011, and the market is expected to peak in 2013 with sales of 28 million units and the market will start to decline from then onwards due to competition from highly functional media tablets. IDC predicted e-Reader shipments of 27 million units in 2011 a massive rise in unit shipments when compared to 12.8 million units in 2010. Analyst firm Juniper Research forecasts that eReader shipments will reach 67 million by 2016 nearly triple the 25 million devices the company expects to reach the market in 2011. According to a Report by Global Industry Analysts, Inc, World e-readers market is forecast to reach 53.87 million units by the year 2017. Renub Research expects worldwide E-Reader unit sales will cross 50 Million and its market size will be over US$ 6 Billion by the end of 2014. According to the latest industry analysis from the Pew Internet & American Life Project, the share of adults in the United States who own tablet computers and e-readers nearly doubled from 10% to 19% between mid-December and early January.